
The stock market is a marketplace where buyers and sellers trade shares of publicly listed companies. It is one of the most powerful wealth-building mechanisms available to ordinary people — and one of the most misunderstood. Millions of investors participate daily without truly understanding how prices are set, what drives market movements, or what distinguishes successful long-term investors from those who consistently underperform. Here is everything a beginner needs to know.
What a Stock Actually Is
A share of stock represents fractional ownership of a company. If a company has 1,000,000 shares outstanding and you own 1,000 of them, you own 0.1% of the company — including a proportional claim on its assets and earnings. As a shareholder, you may receive dividends (a share of profits) and you benefit when the company's value grows. You also bear the risk that the company's value declines or — in the worst case — that it goes bankrupt and your shares become worthless.
Primary vs Secondary Markets
In the primary market, companies raise capital by issuing new shares to the public for the first time through an Initial Public Offering (IPO). Investment banks underwrite the offering, set the initial price, and place shares with institutional investors and the public. In the secondary market, investors trade those shares among themselves on exchanges. The prices you see quoted throughout the day are secondary market prices — companies do not receive money from secondary market transactions.
How IPOs Work
When a private company wants to raise capital by selling shares to the public, it files with the SEC and works with underwriting banks to set an IPO price range. Early investors and institutional funds typically receive shares at the IPO price before trading begins. On the first day of trading, retail investors can buy shares at whatever price the market sets. IPO stocks can surge dramatically on day one or fall below the offering price. For most retail investors, waiting until the initial volatility settles before buying IPO stocks is the prudent approach.
Major Stock Exchanges
- NYSE (New York Stock Exchange) — largest in the world by total market capitalisation; home to many established blue-chip companies
- NASDAQ — technology-heavy electronic exchange; home to Apple, Microsoft, Amazon, Alphabet, and Meta
- LSE (London Stock Exchange) — Europe's largest exchange; key hub for international listings
- TSE (Tokyo Stock Exchange) — Asia's largest; home to major Japanese multinationals
- SSE (Shanghai Stock Exchange) — China's primary exchange for domestic listings
- BSE / NSE (Mumbai) — India's leading exchanges, among the fastest-growing globally
Key Market Indices
An index is a basket of selected stocks used to measure the performance of a market or segment. The S&P 500 tracks the 500 largest US companies by market capitalisation and is the most widely referenced benchmark for the US stock market. The Dow Jones Industrial Average tracks just 30 large US companies and is price-weighted rather than market-cap-weighted. The NASDAQ Composite tracks all NASDAQ-listed stocks with a heavy technology weighting. When news reports that 'the market was up today,' it is almost always referring to one of these three indices.
Market Capitalisation: Sizing Up Companies
Market capitalisation (market cap) equals share price × total shares outstanding. It is the most common measure of a company's size. Large-cap stocks (typically over $10 billion) tend to be more stable but grow more slowly. Mid-cap stocks ($2–10 billion) offer a balance of growth and stability. Small-cap stocks (under $2 billion) carry higher risk but historically higher long-term returns. Index funds automatically weight holdings by market cap, giving you proportional exposure to companies of all sizes.
How Stock Prices Are Determined
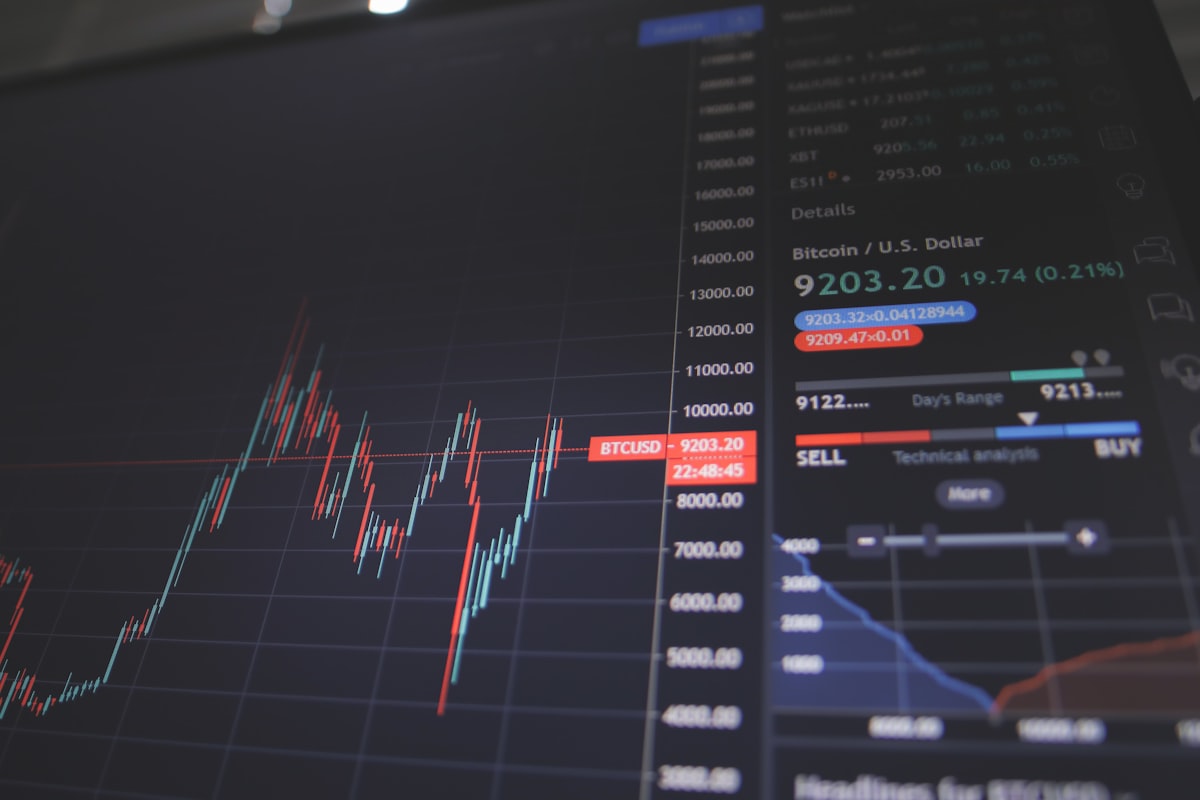
Stock prices are set by supply and demand. When more investors want to buy a stock than sell it, the price rises. When sellers outnumber buyers, the price falls. In the short run, prices are driven by news, earnings reports, economic data, sentiment, and speculation. In the long run, prices converge toward the fundamental value of the business — its earnings, growth rate, and assets. This is why short-term stock movements are nearly impossible to predict, while long-term returns are more predictable and tied to corporate earnings growth.
Bull Markets and Bear Markets
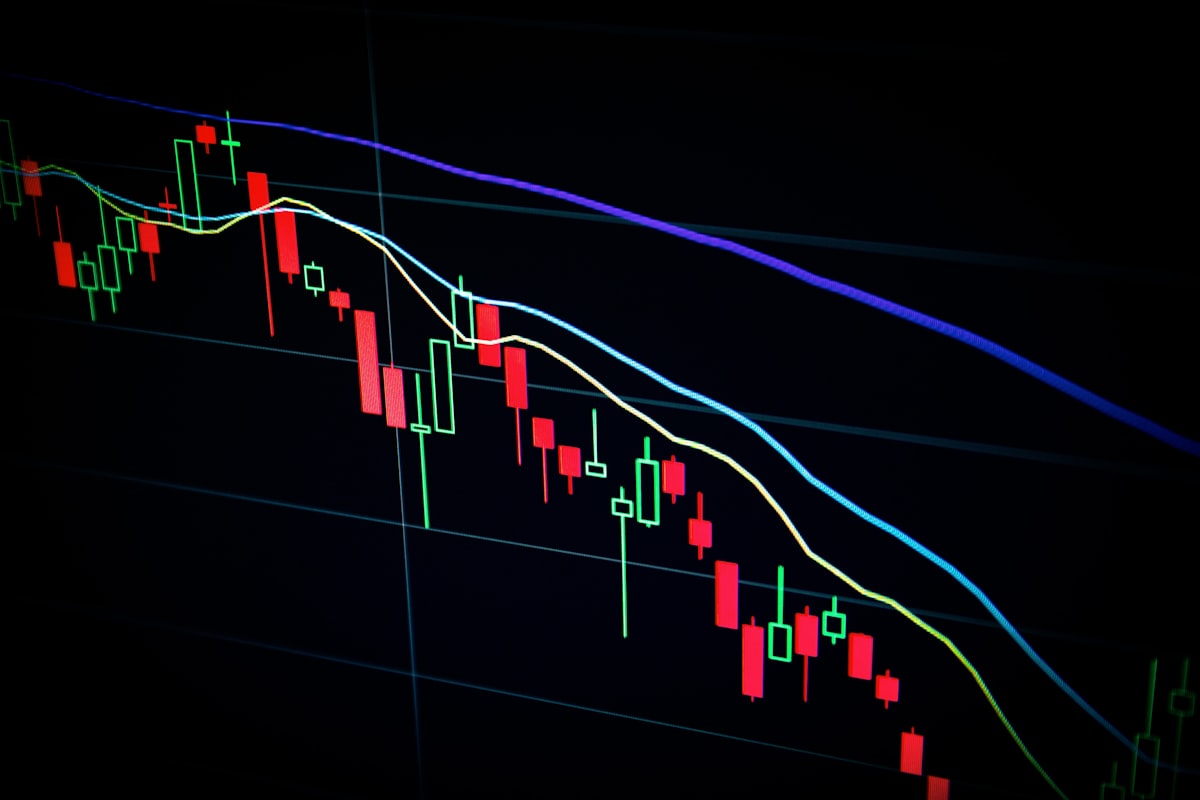
A bull market is a period of broadly rising stock prices — conventionally defined as a 20%+ rise from a recent low. A bear market is a 20%+ decline from a recent high. Bull markets historically last longer than bear markets. Since 1926, the US market has spent approximately 78% of the time in a bull market. Bear markets, though painful, have always been temporary — every single bear market in US history has eventually been followed by new all-time highs. The key is avoiding panic selling during the downturn.
Market Participants
- Retail investors — individual people buying and selling for personal accounts
- Institutional investors — mutual funds, pension funds, insurance companies managing trillions in assets
- Hedge funds — pooled vehicles using sophisticated strategies including short-selling and derivatives
- Market makers — firms that continuously offer to buy and sell specific stocks, providing liquidity
- High-frequency traders — algorithmic traders executing thousands of trades per second for tiny per-trade profits
- Central banks — can influence markets through monetary policy and, in some countries, direct equity purchases
Common Investing Strategies
Passive investing involves buying and holding a diversified index fund for the long term, minimising costs and taxes. Active investing involves selecting individual stocks or timing the market trying to outperform the index — most professionals fail at this after fees. Value investing, popularised by Benjamin Graham and Warren Buffett, focuses on buying stocks trading below their intrinsic value. Growth investing targets companies with high expected earnings growth even if current valuations are elevated. Dividend investing prioritises stocks with consistent and growing dividend payouts for income.
Common Beginner Mistakes
- Trying to time the market — research consistently shows that missing just the 10 best trading days over a decade can cut returns in half
- Panic selling during downturns — turning paper losses into permanent losses by selling at the bottom
- Chasing recent winners — buying what has already risen and selling what has already fallen, a pattern that reliably destroys returns
- Ignoring fees — even a 1% annual fee difference compounds to tens of thousands of dollars over a career
- Concentrating in a single stock or sector — one company scandal or sector collapse can devastate an undiversified portfolio
- Checking your portfolio obsessively — frequent monitoring encourages emotional trading; check quarterly at most
Long-Term Historical Performance
The US stock market has returned approximately 10% per year on average (roughly 7% after inflation) over the past century, through two World Wars, the Great Depression, multiple recessions, financial crises, pandemics, and political upheaval. Every single decade has included at least one significant downturn — but patient, diversified, long-term investors have consistently been rewarded. The enemy of good investment returns is not volatility; it is the emotional reaction to volatility that causes investors to sell at lows and buy at highs.
Do not try to time the market. Time in the market beats timing the market for virtually all investors in virtually all circumstances. Set up automatic investments on a regular schedule, diversify broadly, keep fees low, and focus on the long term.